$79,029.94 spent on AWS in March - A full breakdown of Kit's AWS bill

Overview
We spent $79,029.94 on AWS in March. This is up 8.7% from February and is 4.5% of MRR in March.
This post will be a bit different than previous posts in that I explain more about how we configured our service and how much we spend on each piece. It is not exhaustive, but it covers most of how our application is wired together in AWS.
High-level breakdown:
- EC2-Instances - $21,905.28 (+14%)
- Relational Database Service - $20,796.04 (+8%)
- EC2-Other - $9,949.56 (-3%)
- S3 - $8,408.98 (+20%)
- Savings Plans for Compute usage - $7,142.40 (+7%)
- Support - $5,300.26 (+8%)
- EC2-ELB - $2,322.43 (+6%)
Web Applications - $1,989.45
We built the Kit web apps with Ruby on Rails. The web apps are deployed on EC2 using autoscaling groups. The autoscaling groups have no autoscaling policies other than maintaining a static count. We’re changing this as soon as we migrate to Kubernetes. The Kit web apps run on 16 servers across three availability zones.
- EC2-Instances - $1,989.45
- We served 2.63 Billion requests and 70.62 TB egress data to the internet in March.

Sidekiq - $5,586.26
We use Sidekiq to process our background jobs. Our Sidekiq workers are also deployed on EC2 with autoscaling groups without autoscaling policies. We will migrate these to Kubernetes first and will be able to take advantage of the autoscaling capabilities combined with native Kubernetes PreStop Hooks.
- EC2-Instances - $5,586.26
- We process about 300 million Sidekiq jobs per day across 80 machines.

Elasticsearch - $5,330.66
We run two ElasticSearch clusters. One stores application data so we can have fast statistics and the other stores our logs. We use i3.2xlarge instances to store our application data, and we use i3en.2xlarge instances to store our logs.
We spent $2995.36 on i3.2xlarge instances for 15.3TB of storage. This storage is split across our application data and our logs.
We spent $2,335.30 on i3en.2xlarge instances for 16.1TB of storage. We use these exclusively for storing our production logs.
We’re currently storing about 30TB of logs. 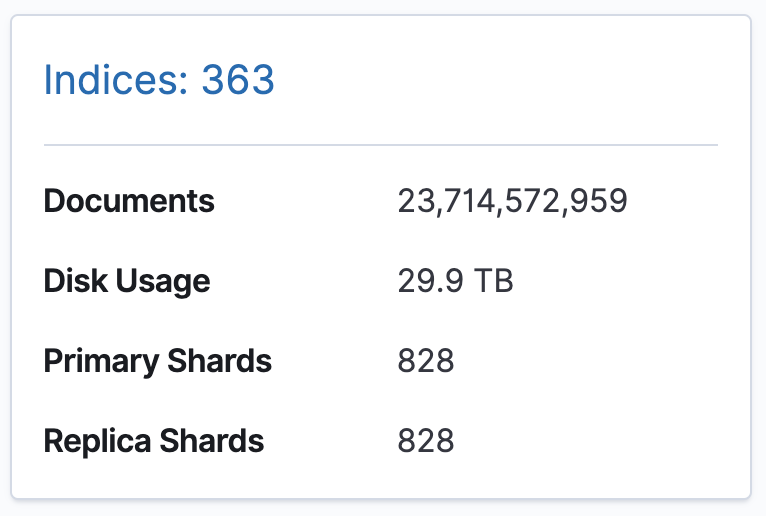
Cassandra - $5,991.21
We run one Cassandra cluster that spans two regions and six availability zones. We spent $5991.21 on i3.2xlarge instances for 15.3TB of storage replicated across two regions in March.
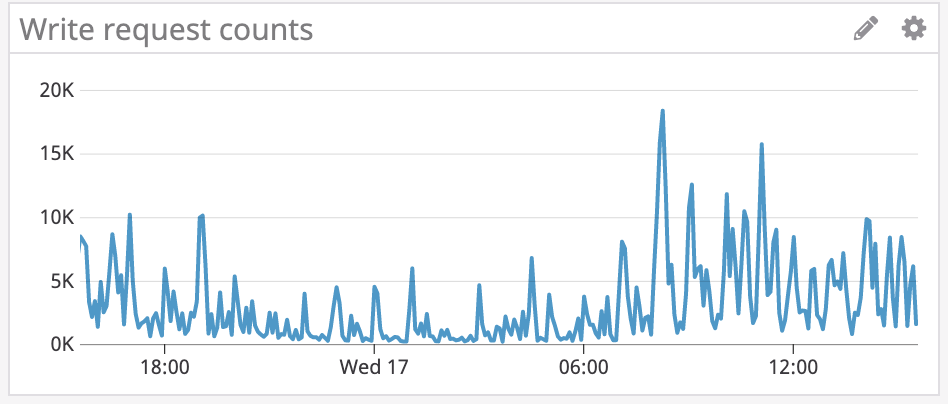
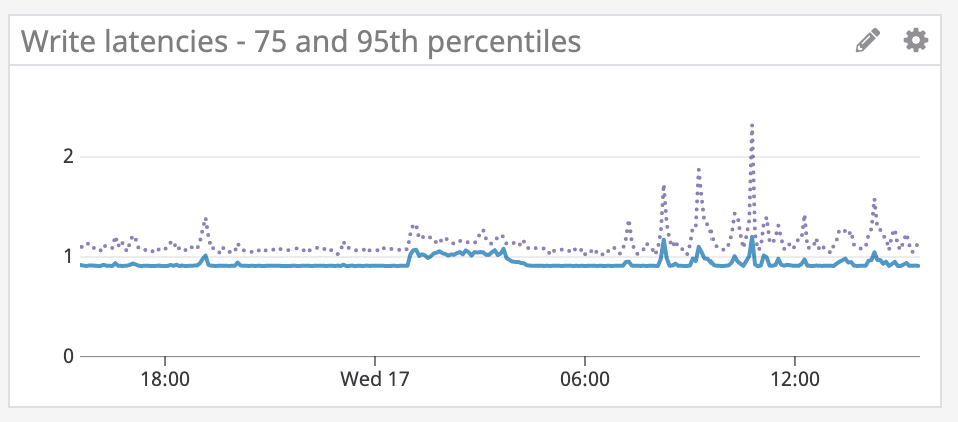
At peak times, we handle over 20k write operations per second while maintaining sub-millisecond p75 latencies and just over 1ms p95 latencies.
MySQL - $17,155.10
MySQL is our oldest data store. We migrated parts of the app from MySQL to Cassandra last year, but it is still the data store we rely the most on. We have a primary and two replicas. The primary and one replica are reserved, but the other replica is on-demand.
We spent $4,949.68 on our primary db.r5.12xlarge instance, $4,506.85 on our two db.r4.8xlarge instances, $730.90 on several smaller databases, and $6,967.66 on USE2-RDS:Multi-AZ-GP2-Storage, USE2-RDS:GP2-Storage, USE2-RDS:GP2-Storage, and RDS:ChargedBackupUsage.
Other AWS Costs
These are shared costs between services. They are not things we can pin to any one particular part of our infrastructure.
EC2-Other - $9,949.56 (-3%)
- USE2-DataTransfer-Regional-Bytes - $5,846.48 (-12%)
- This is the cost of our application to communicate within our VPC.
- USE2-EBS:VolumeUsage.gp2 - $1,273.89 (+4%)
- This is the cost of the storage volumes mounted on our instances.
- USE2-NatGateway-Bytes - $1,332.39 (+25%)
- This is the cost of egress data from our private subnets.
Savings Plan - $7,142.40 (+7%)
We saved $2,708.61 in March from purchasing this. 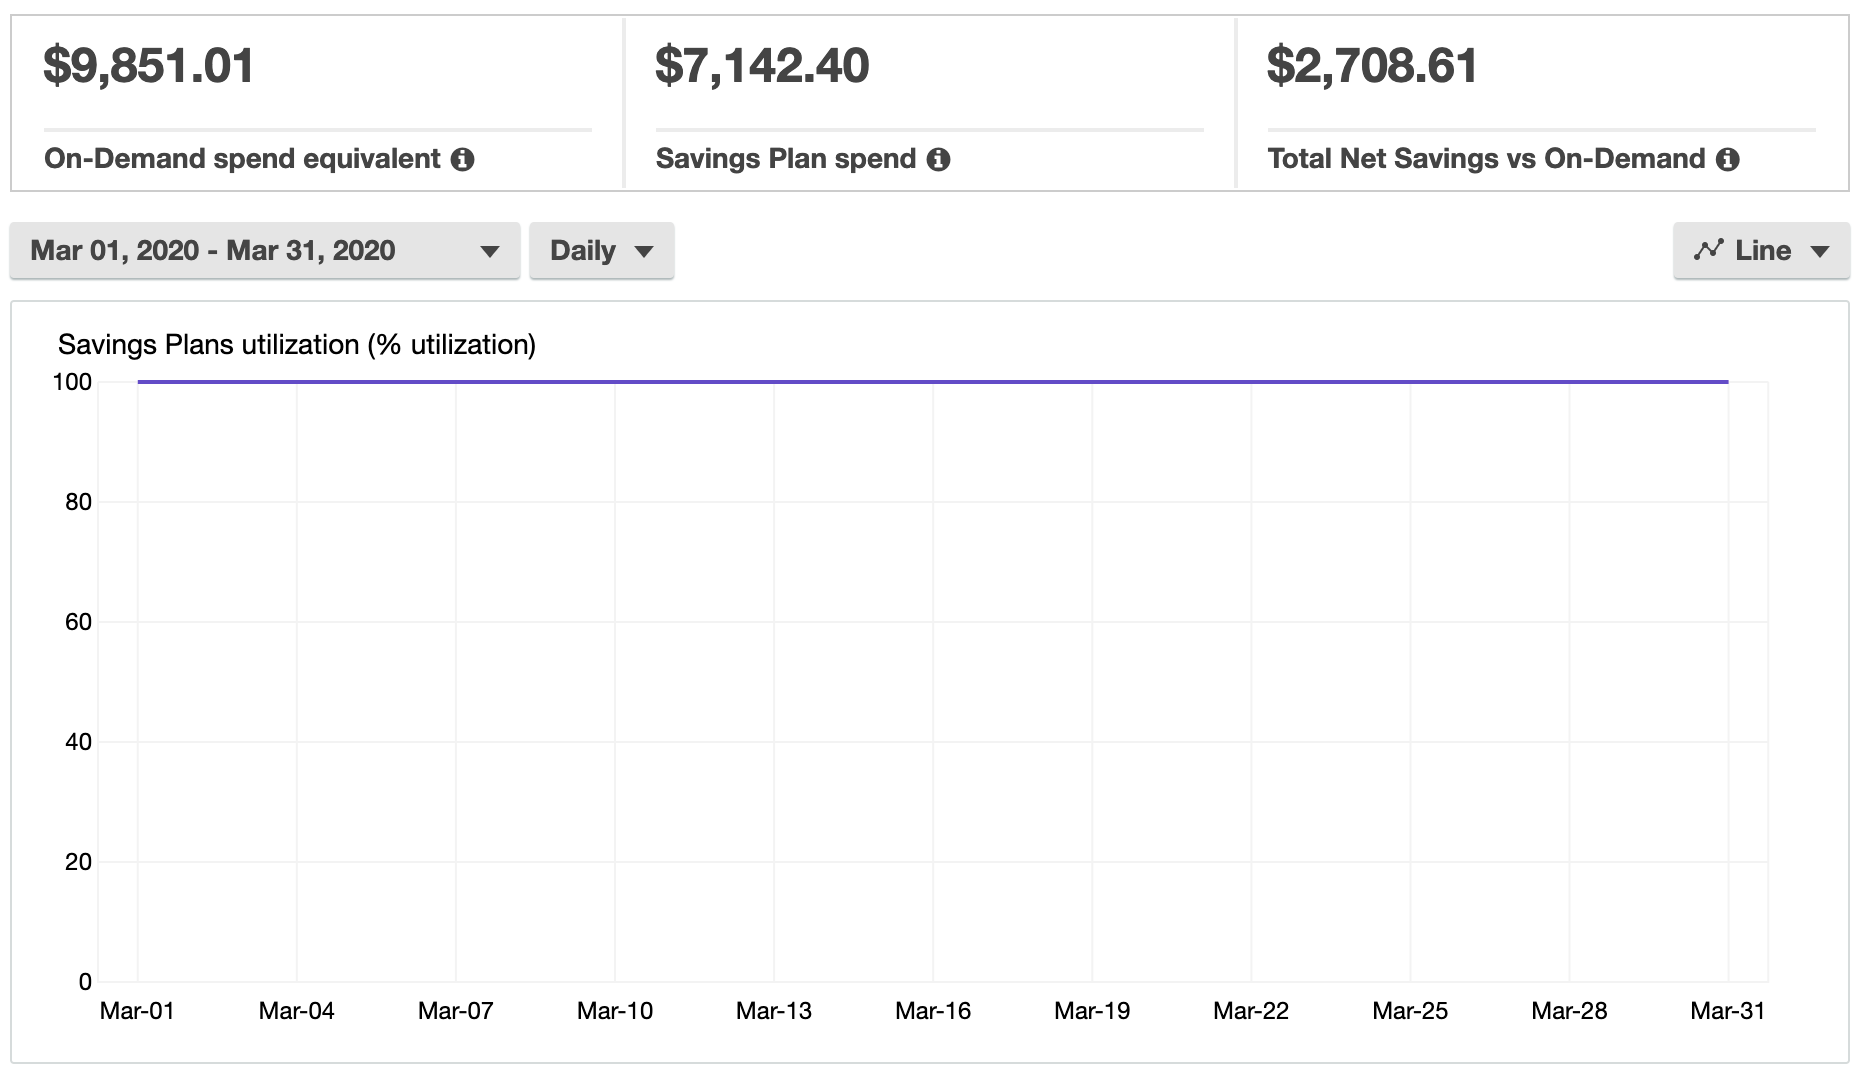
S3 - $8,408.98 (+20% )
We use S3 for everything from storing our static web assets to storing email attachments.
In March, we had an outage with an upstream service provider that acts as a CDN for us. When they had their outage, we had to reroute our traffic to S3, which caused a significant increase in egress from S3 until the vendor was able to restore service.
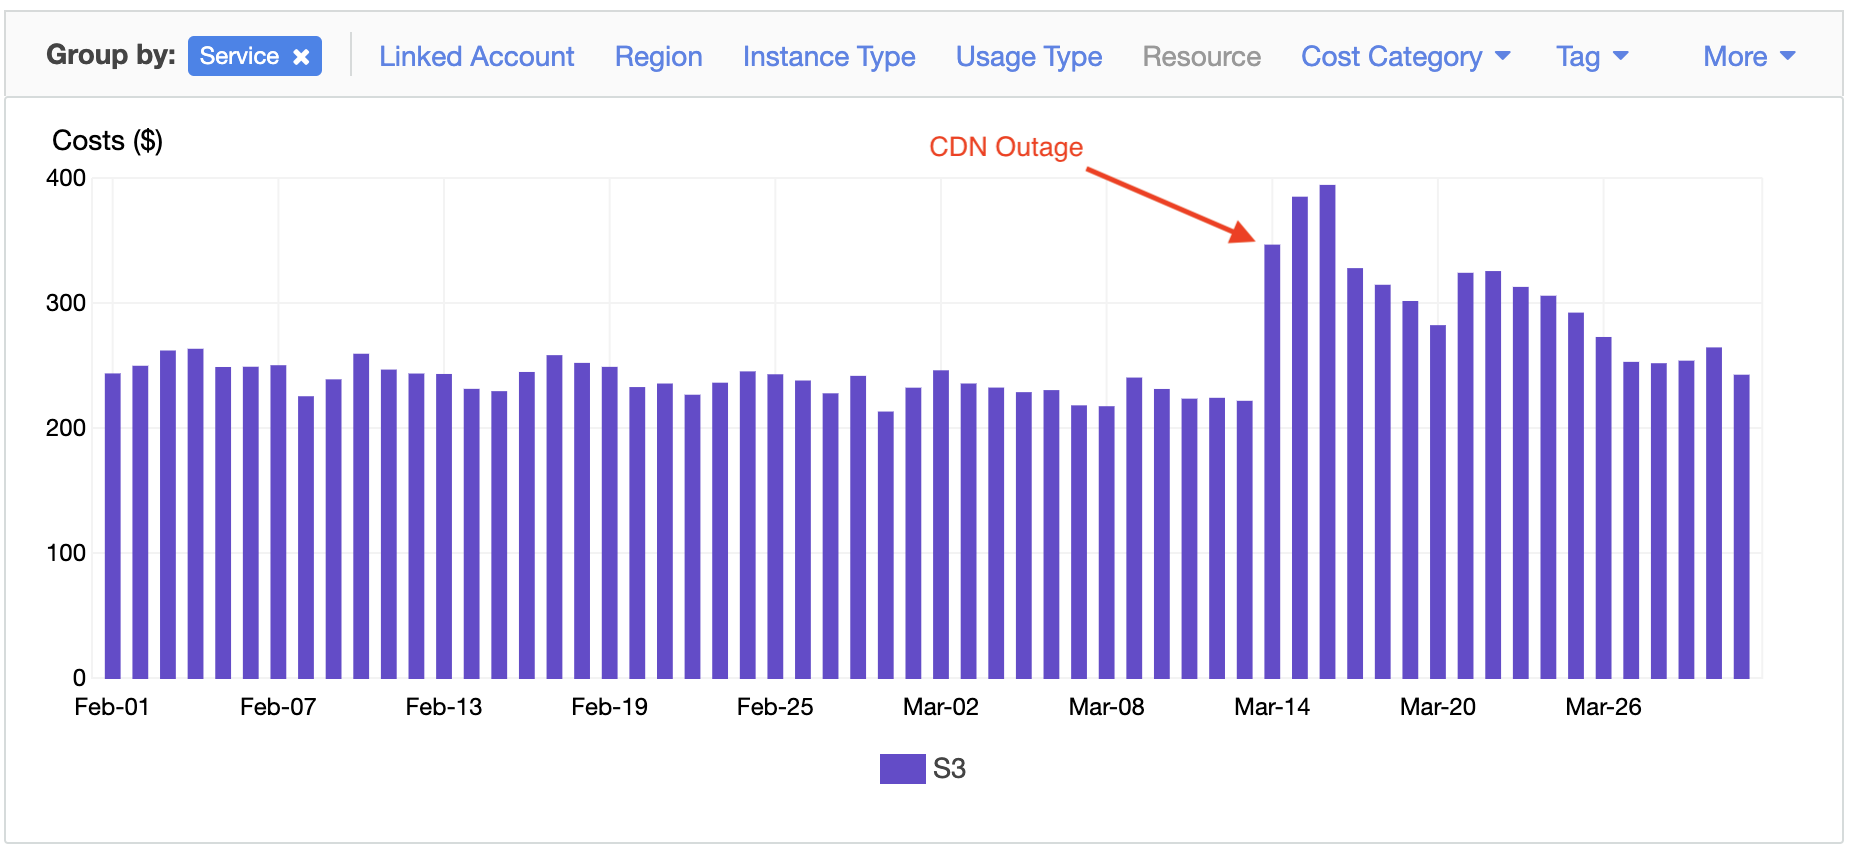
Here’s the breakdown of our S3 usage:
- USE2-DataTransfer-Out-Bytes - $2,681.01 (+76%)
- In March, an upstream service provider had an outage that forced us to serve traffic directly through S3 instead of through their CDN, which increased our data transfer costs.
- USE2-TimedStorage-ByteHrs - $2,107.90 (+3%)
- S3 also stores our backups.
- These backups use S3 lifecycle policies and are deleted after a certain amount of time.
- DataTransfer-Out-Bytes - $1,621.17 (+6%)
- Just like above, we increased here because an upstream service provider had a CDN outage.
Support - $5,300.26 (+8%)
- 7% of monthly AWS usage from $10K-$80K - $3,300.26 (+12%)
- This is the cost of our production account and billing account.
- We could save money by turning off support for our billing account.
- 10% of monthly AWS usage for the first $0-$10K - $2,000.00 (+3%)
- This is the cost of our production account and billing account.
- We could save money by turning off support for our billing account.
EC2-ELB - $2,322.43 (+6%)
We use ELBs throughout our infrastructure. We use them for our public web apps, internal apps, elasticsearch clusters, landing pages, and everything in-between.
We’re working on decreasing costs here as we migrate off AWS load balancers towards Kubernetes service endpoints.
- USE2-DataTransfer-Out-Bytes - $802.96 (-12%)
- This is the amount of data that we’re transferring out from our load balancers to the internet.
- USE2-LCUUsage - $733.62 (+12%)
- This is the cost of Load Capacity Units which are composed of:
- New connections or flows - Number of newly established connections per second
- Active connections - Number of active connections per minute
- Processed bytes - The number of bytes processed by the load balancer in Gigabytes
- This is the cost of Load Capacity Units which are composed of:
- USE2-LoadBalancerUsage - $706.40 (+28%)
- As the name implies, this is the cost associated with load balancer usage in the US-East-2 region.
Conclusion
This is a high-level overview of how Kit is architected and the costs associated with each piece of infrastructure. The next step in our cost-saving strategy is to move to Kubernetes. Kubernetes opens the possibility of using spot instances to scale our fleet while optimizing for cost.
Breaking down and understanding our bill by piece by piece was initially helpful for understanding which parts of our architecture needed revision. Now, it’s helpful to predict future spending and set expectations for new projects.